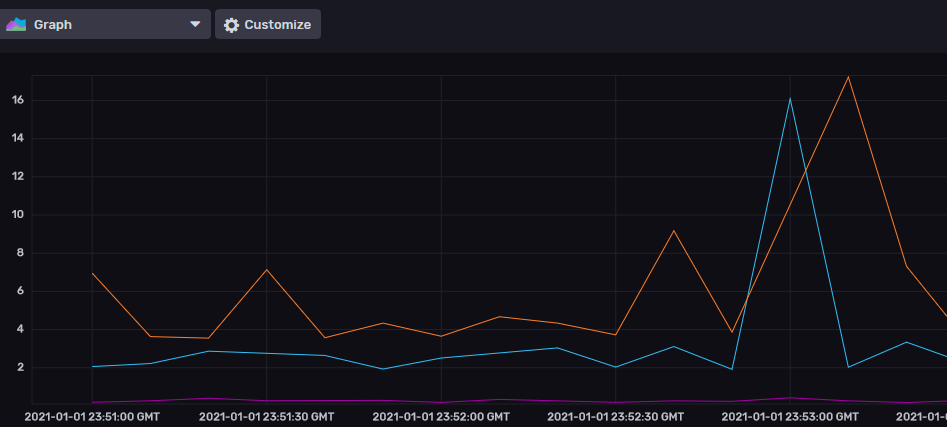
DIY Uptime monitor - show & tell
Trying to troubleshoot some intermittent network instability & didn't feel like configuring smokeping. So instead I decided to see if I can hack something together that just continuously scans the 255 IPs in the subnet.
20 lines of code, thrown into a LXC is now streaming data to a InfluxDB for the ~25 devices/VMs on my net

...pretty chuffed with the outcome. ![]() Hopefully by tomorrow morning it'll have accumulated enough data to see what's going on
Hopefully by tomorrow morning it'll have accumulated enough data to see what's going on


Comments
well done havoc , i know how you feel.
you will be exploring/debugging something else ... so enjoy what is remaining of the 1st day and have a moment of
Good job, awesome feeling to complete things like this. What are you using for the graph?
I really want a self hosted hetrixtools server monitor, but there's always hetrixtools.
Get the best deal on your next VPS or Shared/Reseller hosting from RacknerdTracker.com - The original aff garden.
No separate tool - InfluxDB 2 has charting built in. So much easier than a prometheus+grafana stack.
There is always netdata. They've got a live demo on their site & install is like a 2 minute job. Though not technically an uptime tool I guess. Or zabbix if you like complicated.
Yesterday i finished the back-end code for a "blacklist monitor" project i am working on. Currently working on the front-end.
One of the follow steps is to evaulate uptime monitoring from multiple locations.
★ MyRoot.PW ★ Dedicated Servers ★ LIR-Services ★ Web-Hosting ★
★ Locations: Austria + Netherlands + USA ★ [email protected] ★