That's right! Netdata, or perhaps Grafana, would show us, very beautifully, a great deal of important information in one place. Much prettier than the Proxmox graphs!
On the other hand, how would Netdata or Grafana bring us significantly closer to understanding the root cause of the issue than the information available in Proxmox?
On the other hand, how would Netdata or Grafana bring us significantly closer to understanding the root cause of the issue than the information available in Proxmox?
It shows a lot more info straight out the box. Interpretting it for root cause is another question entirely though. Another attempt to screenshot it:


Comments
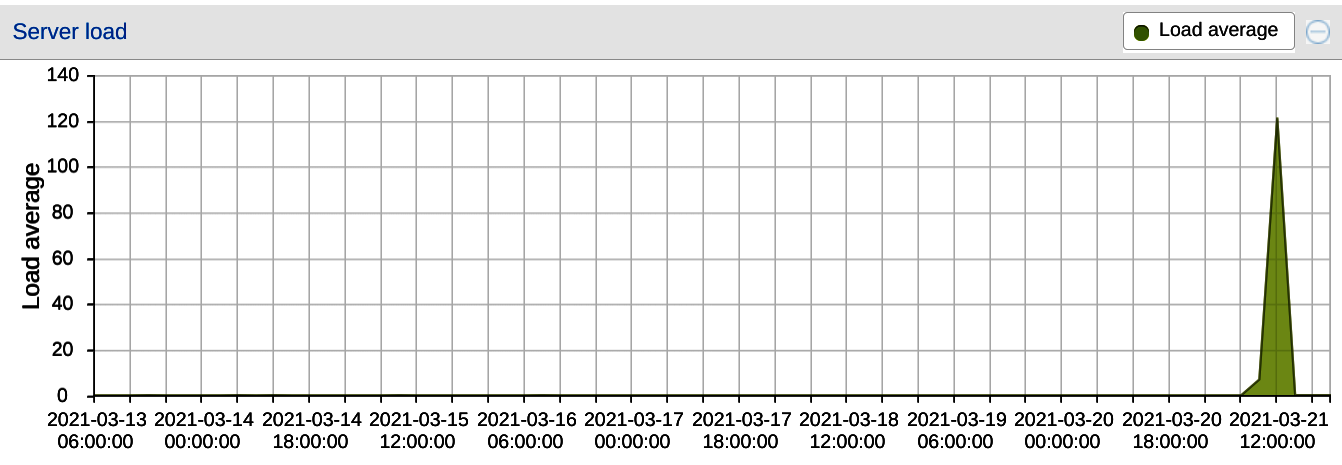
Maybe whatever happened involves this VM:
MetalVPS
If you load netdata onto the underlying server you get more graphs without any extra effort re configuring the dashboard.
Integrates well with proxmox...can see into VMs and LXC. CPU, mem, network etc
Hi @havoc! Thanks for the tip!
That's right! Netdata, or perhaps Grafana, would show us, very beautifully, a great deal of important information in one place. Much prettier than the Proxmox graphs!
On the other hand, how would Netdata or Grafana bring us significantly closer to understanding the root cause of the issue than the information available in Proxmox?
Greetings from Mexico! ??????️????
MetalVPS
It shows a lot more info straight out the box. Interpretting it for root cause is another question entirely though. Another attempt to screenshot it:
Beautiful!")
MetalVPS